Originally published on Medium
Ingest Opentelemetry Logs, Traces and Metrics Directly into Snowflake as an APM and SIEM Replacement or Augumentation#
Let me show you one example how you can ingest traces, logs and metrics natively into Snowflake using the Opentelemetry receiver I put together that is able to receive logs, metrics and traces using the OTLP/gRPC protocol via HTTP(S).
You can find all my code here to get this to work in your own Snowflake account.
But let’s look at the big picture what we can do here.
If you consider that you can have Snowflake write into Apache Iceberg tables and you can query that data from any Iceberg compatible query engine you can create a completely open observability and security data lake without worrying about storage, storage costs or scalability.
The benefits here are that you leverage the Opentelemetry ecosystem of connectors and plug those natively into Snowflake in order to receive logs, traces and metrics so that you can build your own observability and security data lake if you also use Snowflakes ability to create and manage Iceberg tables in your own object storage.
You can also have Snowflake natively** notify you or trigger automated actions for automated incident and response management.**

I showed how you can do that in one of my other blog posts here.
If you check out the Github repo, you also see that there is a table that contains only the last 10 mins of logs. This is great for time senstive incident raising.
With Snowflake notebooks you can also go ahead and do some threat hunting or discover any bottle necks in your application code or archictecture.
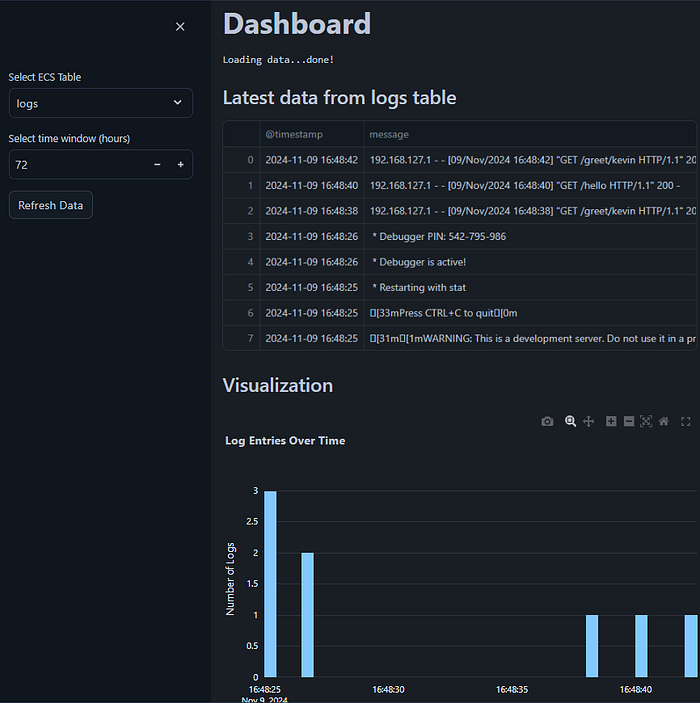
Need some real time dashboards in Snowflake?
I have added an example Streamlit in Snowflake app (SiS) to the Github Repository here:
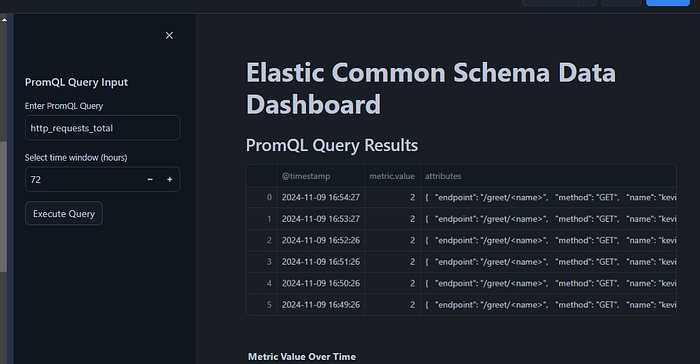
You can also run PromQL queries (experimental)
There is also a sample for Splunk SPL queries:
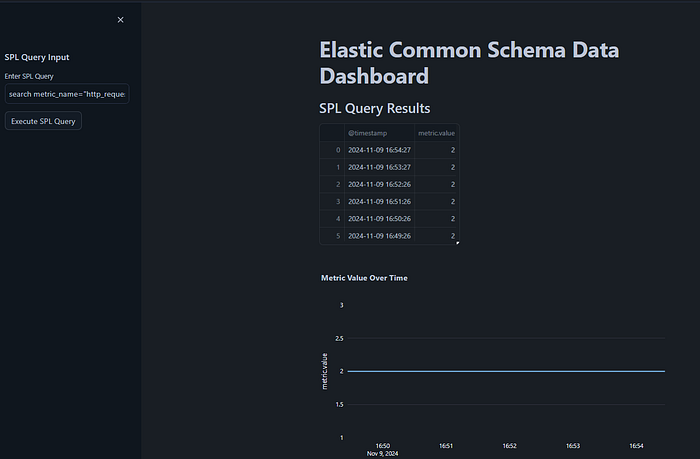
search metric_name="http_requests_total" | table @timestamp, metric.valueNeed further information from other systems and partners?
Easy! Try the Snowflake marketplace:
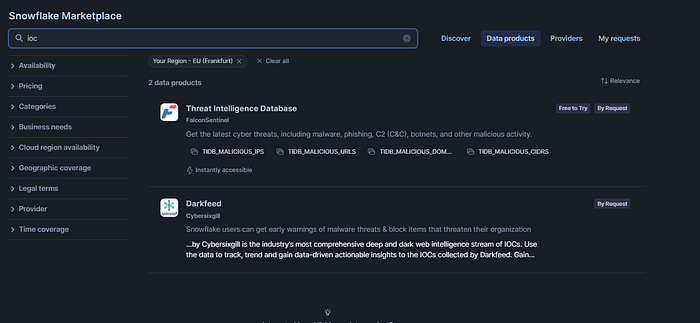
You can also ingest information from Workday (or other HR systems) or Entra AD (or Okta or other IDPs) to enrich the context, here is a sample for Workday:[
How to Load Workday Data into Snowflake Using External Network Access#
This article was co-authored with Daria Rostovtseva, Senior Sales Engineer, Snowflake#
Bottom line:
You can centralise SIEM & APM, logs,traces, metrics, exceptions & alerts in Snowflake.
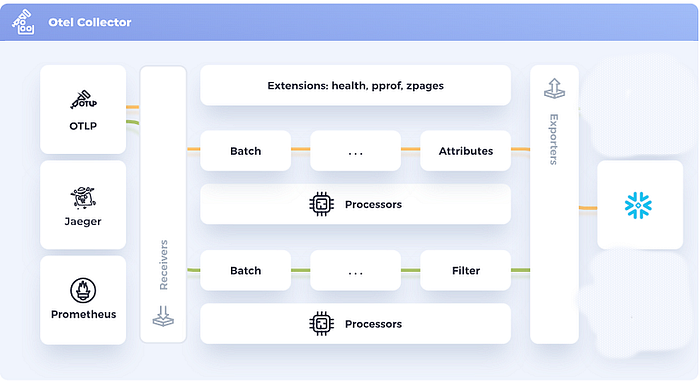
The Opentelemetery eco-system is vast and standarized, allowing you to fetch / ingest , batch, transform and export (forward) data from many sources with ease.
You can also point Jeager and Prometheus sources to an Opentelemetry Collector.
The sweet spot of this setup is probably the augementation play in which you keep using your current SIEM and APM solution for the most recent data and augement your setup by moving data to Snowflake instead of putting it into a long term storage, so all data is always ready to be queried and does not need to be hydrated first.
You can point your current SIEM and APM solution to the Opentelemetry Collector which will deliver the data to Snowflake.
Enough talk.. let’s setup a demo.
For that we will use a Flask sample application that sends logs, traces and metrics to an Opentelemtry collector which forwards it to a container in Snowflake that receives it and writes this data into the respective tables.
We will use Iceberg tables for the final target tables as last step of this tutorial.
The final target tables will also be transformed to adhere to the Elastic Common Schema format in order to standarize all logs, metrics and traces from different sources in a standard schema. That makes it easier to work with the data and scale.
Here is the data flow of the demo:
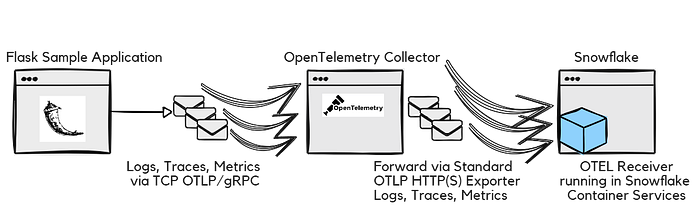
So lets go ahead and get this running.
We will do it in 2 steps.
Step 1: Let’s run all components locally first with Docker Compose.
Step 2: We will run the Snowflake OTEL Receiver in Snowflake Container Services while only the OpenTelemetry Collector and the Flask app will stay running outside of Snowflake.
In a next blog post I will also show how you can have all containers running in Snowflake container services.
So for Step 1:
1a) Clone this Git Repo: https://github.com/KellerKev/snowflake-opentelemetry-receiver
1b) Copy and paste the contents of otel_spcs_prep.sql into your Snowflake SQL workbook.
1c) Work through the workbook until the comment “STOP Here to prepare for Step 1)”.
Make sure you replace the user with your username for this line:
grant role oteltest to user xxx;Here are the full statements we should do for now as well if you want to quickly copy and paste from here:
use role accountadmin;

CREATE OR REPLACE WAREHOUSE otelwh WITH WAREHOUSE_SIZE='X-SMALL';

create role oteltest;

grant usage on WAREHOUSE otelwh  to role oteltest;
grant operate on  WAREHOUSE otelwh to role oteltest;

grant create database on account to role oteltest;

grant role oteltest to user xxx;

use role oteltest;

create database otel;
create schema otelschema;

CREATE or replace TABLE metrics (
      timestamp TIMESTAMP_NTZ,
      metric_name STRING,
      value DOUBLE,
      attributes VARCHAR
);

CREATE or replace TABLE logs (
      timestamp TIMESTAMP_NTZ,
      log_level STRING,
      message STRING,
      attributes varchar
);

CREATE or replace TABLE  traces (
      trace_id STRING,
      span_id STRING,
      name STRING,
      start_time TIMESTAMP_NTZ,
      end_time TIMESTAMP_NTZ,
      attributes varchar
);

select * from metrics;
select * from logs;
select * from traces;
1d) Now that you have the warehouse, the role, the database, schema and tables setup in Snowflake you can spin up the dockercompose.Yaml with Docker Compose which will run the Flask sample app, the Opentelemtry Collector as will as the Snowflake Opentelemetry Receiver all locally, but connect to your Snowflake account via the Python driver.
In order to do that we need to supply the docker-compose.yaml files with your credential first:
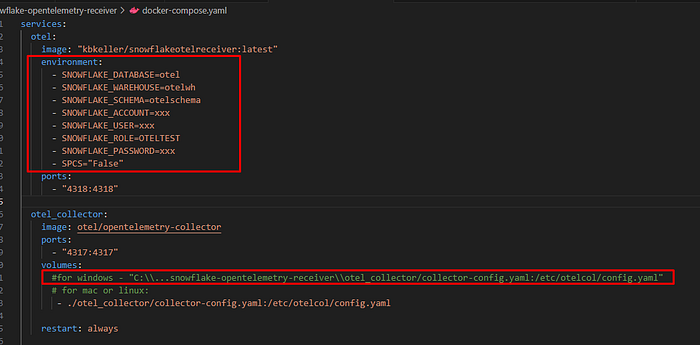
Make sure to put your right credentials here for account, user, password.
The rest should work as is.
If you run Docker Compose on Windows make sure remove the Linux/Mac path line and adapt the one that is prepared for Windows and point it to the OTEL config file that is required that you got from the Git Repository.
1e) Now in the Terminal in the folder of the cloned Git Repository on your PC/Mac or Linux workstation/server enter the command:
docker compose upIn the following demo video is what you should be able to see now.
The 3 containers start up, with the Opentelemetry Snowflake Receiver connecting to your Snowflake instance.
Navigate with your browser to the Flask endpoints of the Flask sample app that sends traces, logs and metrics:
http://localhost:5000/greet/kevin
You can change the name “kevin” to your name or the name of your pet or anything you like.
And also go to:
In your Snowflake account you should now be able to see that the tables logs, traces and metrics have been populated with data.
We are now ready for Step 2) to let the Snowflake Opentelemetry Receiver run in Snowflake container services.
For that we need to upload the Snowflake Opentelemetry Receiver Docker image into your Snowflake accounts image registry.
In order to do that continue with the steps in the otel_spcs_prep.sql file
2a) Let me put the relavent steps for right now here as well if you quickly want to copy and paste from here:
CREATE IMAGE REPOSITORY IF NOT EXISTS oteltestimages;

SHOW IMAGE REPOSITORIES IN SCHEMA;

--before uploading image, if you use a username/password to authenticate and MFA is enabled for your user, you better disable it
-- before uploading for a bit so you dont get locked out and receive 10000 MFA messages:
With this we have an an image repository.
2b) When you execute the command:
SHOW IMAGE REPOSITORIES IN SCHEMA;You should be able to see how you need to tag (rename) the Docker image so we can upload it.
It should look something like this:
xxxx.registry.snowflakecomputing.com/otel/otelschema/oteltestimages2c) Take the value from the repository_url column and copy it.
Now in your terminal on your local workstatation or server make sure you have the image of the Snowflake Opentelemetry Receiver available.
You should have it already if you have followed Step 1).
If not you can either build the image from the Dockerfile provided in the Github repository or pull it from my Dockerhub repository via:
docker pull kbkeller/snowflakeotelreceiver:latest2d) Now lets give this image a tag suitable to upload into the Snowflake image registry:
docker tag kbkeller/snowflakeotelreceiver:latest xxxx.registry.snowflakecomputing.com/otel/otelschema/oteltestimages/otel-image:latestAfterwards we can authenticate and upload.
Before you do the Docker push a word of warning:
Do NOT push yet, read this:
If you have MFA for the user enabled and you are using a password to auth then disable MFA RIGHT NOW. Just for a couple of minutes.
Otherwise you will get a ton of MFA prompts on your phone and you will be locked out of your Snowflake account for 15 minutes and that is all you will achieve.
So to avoid this, go back to your Snowflake account and disable MFA for 10 minutes or so for your user:
USE ROLE ACCOUNTADMIN;
alter user xxxx set mins_to_bypass_mfa=10
2e) Ok back in our terminal we can login and push the image now like so
(first login, then push)
docker login xxxx.registry.snowflakecomputing.com

docker push xxxx.registry.snowflakecomputing.com/otel/otelschema/oteltestimages/otel-image:latest
You will be asked to login with username and password and then you should be able to upload the image to the Snowflake image registry.
2f) Once the upload is done, let’s create a service / container that we run based on on the image in your Snowflake account.
Here are the following useful commands to execute now.
We will create a compute pool, give access to the compute pool to our custom role and then run the container in that compute pool.
We can also check the logs and see the status of everything:
USE ROLE ACCOUNTADMIN;
GRANT BIND SERVICE ENDPOINT ON ACCOUNT TO ROLE oteltest;
CREATE COMPUTE POOL IF NOT EXISTS OTEL_COMPUTE_POOL
MIN_NODES = 1
MAX_NODES = 1
INSTANCE_FAMILY = CPU_X64_S
AUTO_RESUME = true;
DESCRIBE COMPUTE POOL OTEL_COMPUTE_POOL;
grant usage on compute pool OTEL_COMPUTE_POOL to role oteltest;
grant operate on compute pool OTEL_COMPUTE_POOL to role oteltest;
grant monitor on compute pool OTEL_COMPUTE_POOL to role oteltest;
grant modify on compute pool OTEL_COMPUTE_POOL to role oteltest;
use role oteltest;
CREATE SERVICE otel_service
IN COMPUTE POOL OTEL_COMPUTE_POOL
MIN_INSTANCES=1
MAX_INSTANCES=1
FROM SPECIFICATION
$$
spec:
containers:
- name: "otel"
image: "/otel/otelschema/oteltestimages/otel-image:latest"
env:
SNOWFLAKE_DATABASE: "otel"
SNOWFLAKE_WAREHOUSE: "otelwh"
SNOWFLAKE_SCHEMA: "otelschema"
SPCS: "True"
endpoints:
- name: otelhttp
port: 4318
public: true
$$;
describe service otel_service;
SHOW SERVICE CONTAINERS IN SERVICE otel_service;
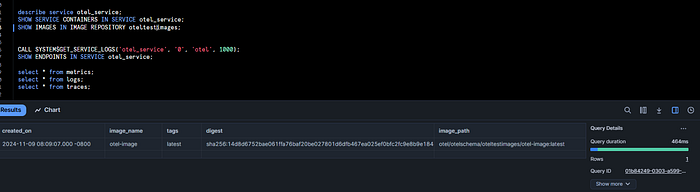
SHOW IMAGES IN IMAGE REPOSITORY oteltestimages;
CALL SYSTEM$GET_SERVICE_LOGS('otel_service', '0', 'otel', 1000);
SHOW ENDPOINTS IN SERVICE otel_service;2g) After the upload you should the see the image in the repository in Snowflake with the “SHOW IMAGES..” SQL command:
2h) So the container should also run now, based on you having executed the SQL commands above in the right order. The relevant command is:
CREATE SERVICE otel_service
  IN COMPUTE POOL OTEL_COMPUTE_POOL
  MIN_INSTANCES=1
  MAX_INSTANCES=1
  FROM SPECIFICATION
  $$
   spec:
     containers:
     - name: "otel"
       image: "/otel/otelschema/oteltestimages/otel-image:latest"
       env:
         SNOWFLAKE_DATABASE: "otel"
         SNOWFLAKE_WAREHOUSE: "otelwh"
         SNOWFLAKE_SCHEMA: "otelschema"
         SPCS: "True"

     endpoints:
     - name: otelhttp
       port: 4318
       public: true
  $$;
2i)
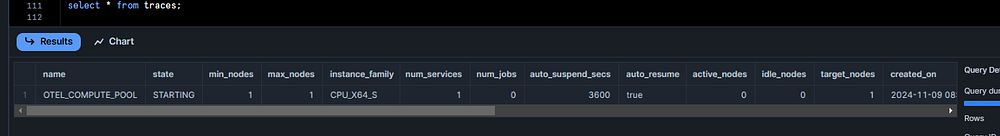
You may have to be patient as compute pools need some time to start up:
Consquently the container may also still be in pending status if the pool is not started yet:
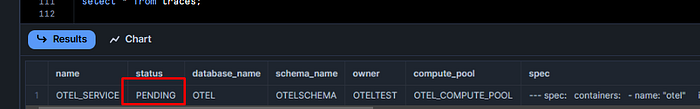
You can check the status with:
describe service otel_service;
DESCRIBE COMPUTE POOL OTEL_COMPUTE_POOL;
2j) Once everything is in running and active state you can check the logs of the Snowflake Opentelemetry receiver:
CALL SYSTEM$GET_SERVICE_LOGS('otel_service', '0', 'otel', 1000);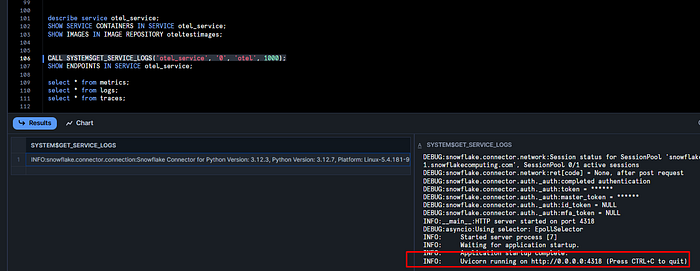
2k) In order to send the logs to the receiver now, we need 2 things:
One is the endpoint url of the receiver and the other is the OAuth token in order to be able to authenticate programmatically to the running container in Snowflake.
Getting the URL is easy:
SHOW ENDPOINTS IN SERVICE otel_service;That should show you something like this:
agtubd-xxxx-up50179.snowflakecomputing.appWhich means the full url that we need for the Opentelemetry Collector running on our server or workstation in the last step is something like;
https://agtubd-xxxx-up50179.snowflakecomputing.app2l) So lets prepare the docker-compose.yaml file and the Opentelemetry Collector config to communicate with the receiver in Snowflake.
Go ahead and open the docker-compose.yaml file in your favourite editor and lets remove the the entry to start the receiver locally:
Just comment out the lines that would start it with the hash in front of each line:
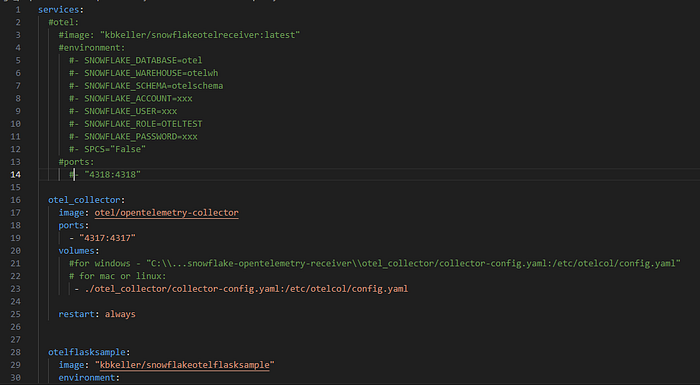
Next we need to point the Opentelemetry collector to the Snowflake container URL:
In the collector-config.yaml replace the entry point to http://otel:4318 with the endpoint you have extracted from Snowflake in the previous step. Also eanble TLS.
So instead of this:
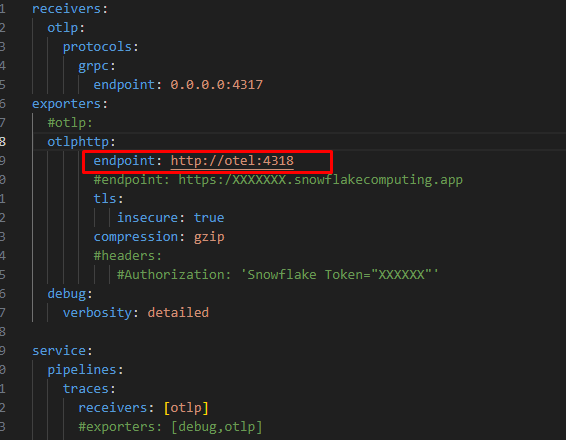
We should now have this:
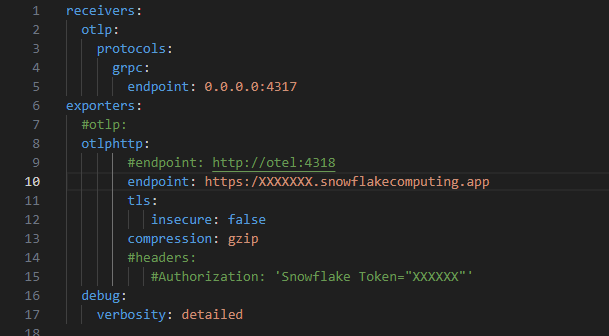
Where tls: insecure is FALSE and the endpoint is the HTTPS endpoint of the Snowflake container.
The last step in this file is to uncommend the headers section and add the right Snowflake OAuth token.
For that you need to generate a RSA keypair for the Snowflake user, assign the the public key to the user in Snowflake and then use the Python script that is part of the repository that is called “access-via-keypair.py”.
The detailed instruction can be found here.
Make SURE to write the role of your user in UPPERCASE letters.
Once you have the token add it to the Opentelemetry Collector config like so:
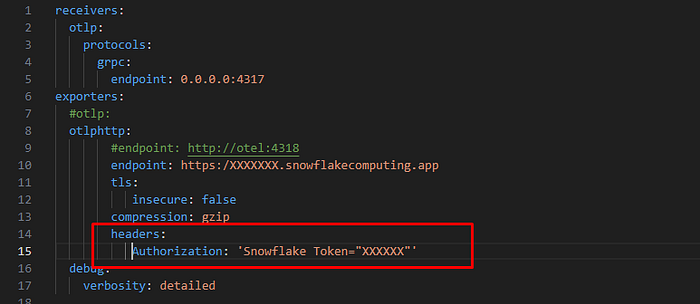
Replace the XXXX with your token, or better yet, put in a environment variable that can be updated. For the first test let’s just put in the token.
2m) Finally you should be able to run Docker compose again with
docker compose upThe Opentelemetry Collector is now collecting the logs, traces and metrics from the Flask sample app (remember to visit the localhost:5000/hello etc. to generate data) and is sending it straight to the Snowflake Opentelemetry Receiver running in Snowflake.
2n) Let’s transform the tables in the Elastic Common Schema into target tables via a Stored Procedure and Streams and Tasks.
-- Create Streams on the source tables
CREATE OR REPLACE STREAM logs_stream ON TABLE logs APPEND_ONLY = TRUE;
CREATE OR REPLACE STREAM metrics_stream ON TABLE metrics APPEND_ONLY = TRUE;
CREATE OR REPLACE STREAM traces_stream ON TABLE traces APPEND_ONLY = TRUE;
Create the stored procedure to transform the tables steams:
CREATE OR REPLACE PROCEDURE ecs_transform_incremental()
RETURNS STRING
LANGUAGE PYTHON
RUNTIME_VERSION = '3.11'
PACKAGES = ('snowflake-snowpark-python')
HANDLER = 'main'
AS
$$
def main(session):
    from snowflake.snowpark.functions import col, parse_json, datediff, lit

    try:
        # Create the target schema if it doesn't exist
        session.sql("CREATE SCHEMA IF NOT EXISTS ecs_schema").collect()

        # ***********************
        # Process Logs
        # ***********************

        # Create the target 'logs' table if it doesn't exist
        session.sql("""
            CREATE TABLE IF NOT EXISTS ecs_schema.logs (
                "@timestamp" TIMESTAMP_NTZ,
                "message" STRING,
                "log.level" STRING,
                "attributes" VARIANT
            )
        """).collect()

        # Read new data from the logs_stream
        logs_df = session.table("logs_stream")

        # Check if there is new data to process
        if logs_df.count() > 0:
            # Transform and insert data into ecs_schema.logs
            logs_transformed = logs_df.select(
                col("timestamp").alias("@timestamp"),
                col("message"),
                col("log_level").alias("log.level"),
                parse_json(col("attributes")).alias("attributes")
            )

            logs_transformed.write.mode("append").save_as_table("ecs_schema.logs")
        else:
            print("No new logs data to process.")

        # ***********************
        # Process Metrics
        # ***********************

        # Create the target 'metrics' table if it doesn't exist
        session.sql("""
            CREATE TABLE IF NOT EXISTS ecs_schema.metrics (
                "@timestamp" TIMESTAMP_NTZ,
                "metricset.name" STRING,
                "metric.value" FLOAT,
                "attributes" VARIANT
            )
        """).collect()

        # Read new data from the metrics_stream
        metrics_df = session.table("metrics_stream")

        # Check if there is new data to process
        if metrics_df.count() > 0:
            # Transform and insert data into ecs_schema.metrics
            metrics_transformed = metrics_df.select(
                col("timestamp").alias("@timestamp"),
                col("metric_name").alias("metricset.name"),
                col("value").alias("metric.value"),
                parse_json(col("attributes")).alias("attributes")
            )

            metrics_transformed.write.mode("append").save_as_table("ecs_schema.metrics")
        else:
            print("No new metrics data to process.")

        # ***********************
        # Process Traces
        # ***********************

        # Create the target 'traces' table if it doesn't exist
        session.sql("""
            CREATE TABLE IF NOT EXISTS ecs_schema.traces (
                "trace.id" STRING,
                "span.id" STRING,
                "span.name" STRING,
                "span.start" TIMESTAMP_NTZ,
                "span.end" TIMESTAMP_NTZ,
                "span.duration" FLOAT,
                "attributes" VARIANT
            )
        """).collect()

        # Read new data from the traces_stream
        traces_df = session.table("traces_stream")

        # Check if there is new data to process
        if traces_df.count() > 0:
            # Calculate span duration
            traces_transformed = traces_df.with_column(
                "span.duration",
                datediff("milliseconds", col("start_time"), col("end_time"))
            ).select(
                col("trace_id").alias("trace.id"),
                col("span_id").alias("span.id"),
                col("name").alias("span.name"),
                col("start_time").alias("span.start"),
                col("end_time").alias("span.end"),
                col("span.duration"),
                parse_json(col("attributes")).alias("attributes")
            )

            traces_transformed.write.mode("append").save_as_table("ecs_schema.traces")
        else:
            print("No new traces data to process.")

        return 'Incremental transformation completed successfully.'
    except Exception as e:
        return 'Error: ' + str(e)
$$;
Lets create the task:
CREATE OR REPLACE TASK ecs_transform_task
WAREHOUSE = your_warehouse_name  -- Replace with your warehouse name
SCHEDULE = '1 MINUTE'
AS
CALL ecs_transform_incremental();
And enable it:
-- Enable the Task

use role accountadmin;
grant EXECUTE TASK on account to role oteltest;
use role oteltest;
ALTER TASK ecs_transform_task RESUME;
You can monitor tasks as ACCOUNTADMIN like this:
show tasks;
show alerts;

SELECT * from LOGIN_EVENTS;

-- monitor alerts & tasks

SELECT *
FROM
  TABLE(INFORMATION_SCHEMA.ALERT_HISTORY(
    SCHEDULED_TIME_RANGE_START
      =>dateadd('hour',-1,current_timestamp())))
ORDER BY SCHEDULED_TIME DESC;

SELECT *
FROM
  TABLE(INFORMATION_SCHEMA.TASK_HISTORY(
    SCHEDULED_TIME_RANGE_START
      =>dateadd('hour',-1,current_timestamp())))
ORDER BY SCHEDULED_TIME DESC;
Now that the task is running you sould see a new schema in the database called “ECS_SCHEMA”:
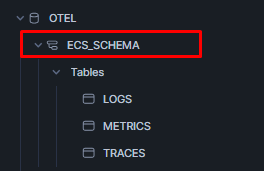
Where you can now find the logs, metrics and traces table schemas modfied to comply to ECS:
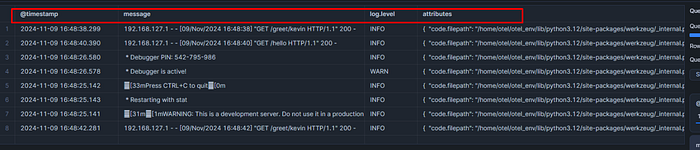
These target tables could be modified to be Iceberg tables as promised so that you can get started with having all the data in an open security and observability data lake.
Just create the table as type Iceberg with Snowflake providing the catalog and setup the external stage (s3, blob or gcp).
Here is how you can do it quickly, if you have an external stage ready:
Stop the task for a bit:
use role oteltest;
ALTER TASK ecs_transform_task suspend;
Then navigate to the ECS_SCHEMA and lets drop the tables we have there for now:
drop otel.ecs_schema.logs;
drop otel.ecs_schema.metrics;
drop otel.ecs_schema.traces;
Now in the schema, lets re-create those tables as Iceberg tables (for my_ext_vol and ‘my/relative/path/from/extvol’ use the values appropiate for your setup)
create or replace ICEBERG TABLE OTEL.ECS_SCHEMA.LOGS (
 "@timestamp" TIMESTAMP_NTZ(9),
 "message" VARCHAR(16777216),
 "log.level" VARCHAR(16777216),
 "attributes" VARIANT
)
CATALOG = 'SNOWFLAKE'
  EXTERNAL_VOLUME = 'my_ext_vol'
  BASE_LOCATION = 'my/relative/path/from/extvol';

create or replace ICEBERG TABLE OTEL.ECS_SCHEMA.METRICS (
 "@timestamp" TIMESTAMP_NTZ(9),
 "metricset.name" VARCHAR(16777216),
 "metric.value" FLOAT,
 "attributes" VARIANT
)
CATALOG = 'SNOWFLAKE'
  EXTERNAL_VOLUME = 'my_ext_vol'
  BASE_LOCATION = 'my/relative/path/from/extvol';

create or replace ICEBERG TABLE OTEL.ECS_SCHEMA.TRACES (
 "trace.id" VARCHAR(16777216),
 "span.id" VARCHAR(16777216),
 "span.name" VARCHAR(16777216),
 "span.start" TIMESTAMP_NTZ(9),
 "span.end" TIMESTAMP_NTZ(9),
 "span.duration" FLOAT,
 "attributes" VARIANT
)
CATALOG = 'SNOWFLAKE'
  EXTERNAL_VOLUME = 'my_ext_vol'
  BASE_LOCATION = 'my/relative/path/from/extvol';

ALTER TASK ecs_transform_task resume;
Next steps:
In the next posts we will move all container components of this demo setup into Snowflake and also how we can use Snowflake notebooks for data crunching and threat hunting.
We will also introduce batching on the Opentelemetry Collector in order to send data more efficiently to Snowflake.
We will also add the ingestion of VECTOR and Fluentd data in a similiar manner.